On the Washington Post's Elections Engineering team, I worked to ensure the functionality and effective storytelling on our 2020 election results pages, contributing to the entire stack from scraping and data processing all the way to visualization.
Built a system to aggregate early voting and turnout data from all 50 states, then analyzed and visualized results for this live tracker that ran for a month ahead of the 2020 election, gaining millions of readers and front-page placement in print and digital.
For my honors thesis in journalism, I conducted user-experience research to examine graphics in augmented reality, creating a series of AR data visualizations about fundraising in the 2020 primary race. Using feedback and observations of participants in a user-testing study, I created some guidelines for designing better graphics in augmented reality.
As one of the news developers building The Guardian's 2020 primary live coverage, I styled the state results embeds to fit our house style, designed and built the summary view on the top of the Super Tuesday page, and created embeddable views for our homepage and live blogs.
I built a database system that let Guardian reporters analyze the latest FEC filings from 2020 candidates — then used that database to write this story, looking at donors by occupation.
I assisted with data analysis for this story, which highlights how bands are gaming the Billboard charts by bundling albums with ticket sales. I scraped data from Billboard and Spotify, built an interactive, and designed a full-width print graphic for the Journal's weekend Exchange section.
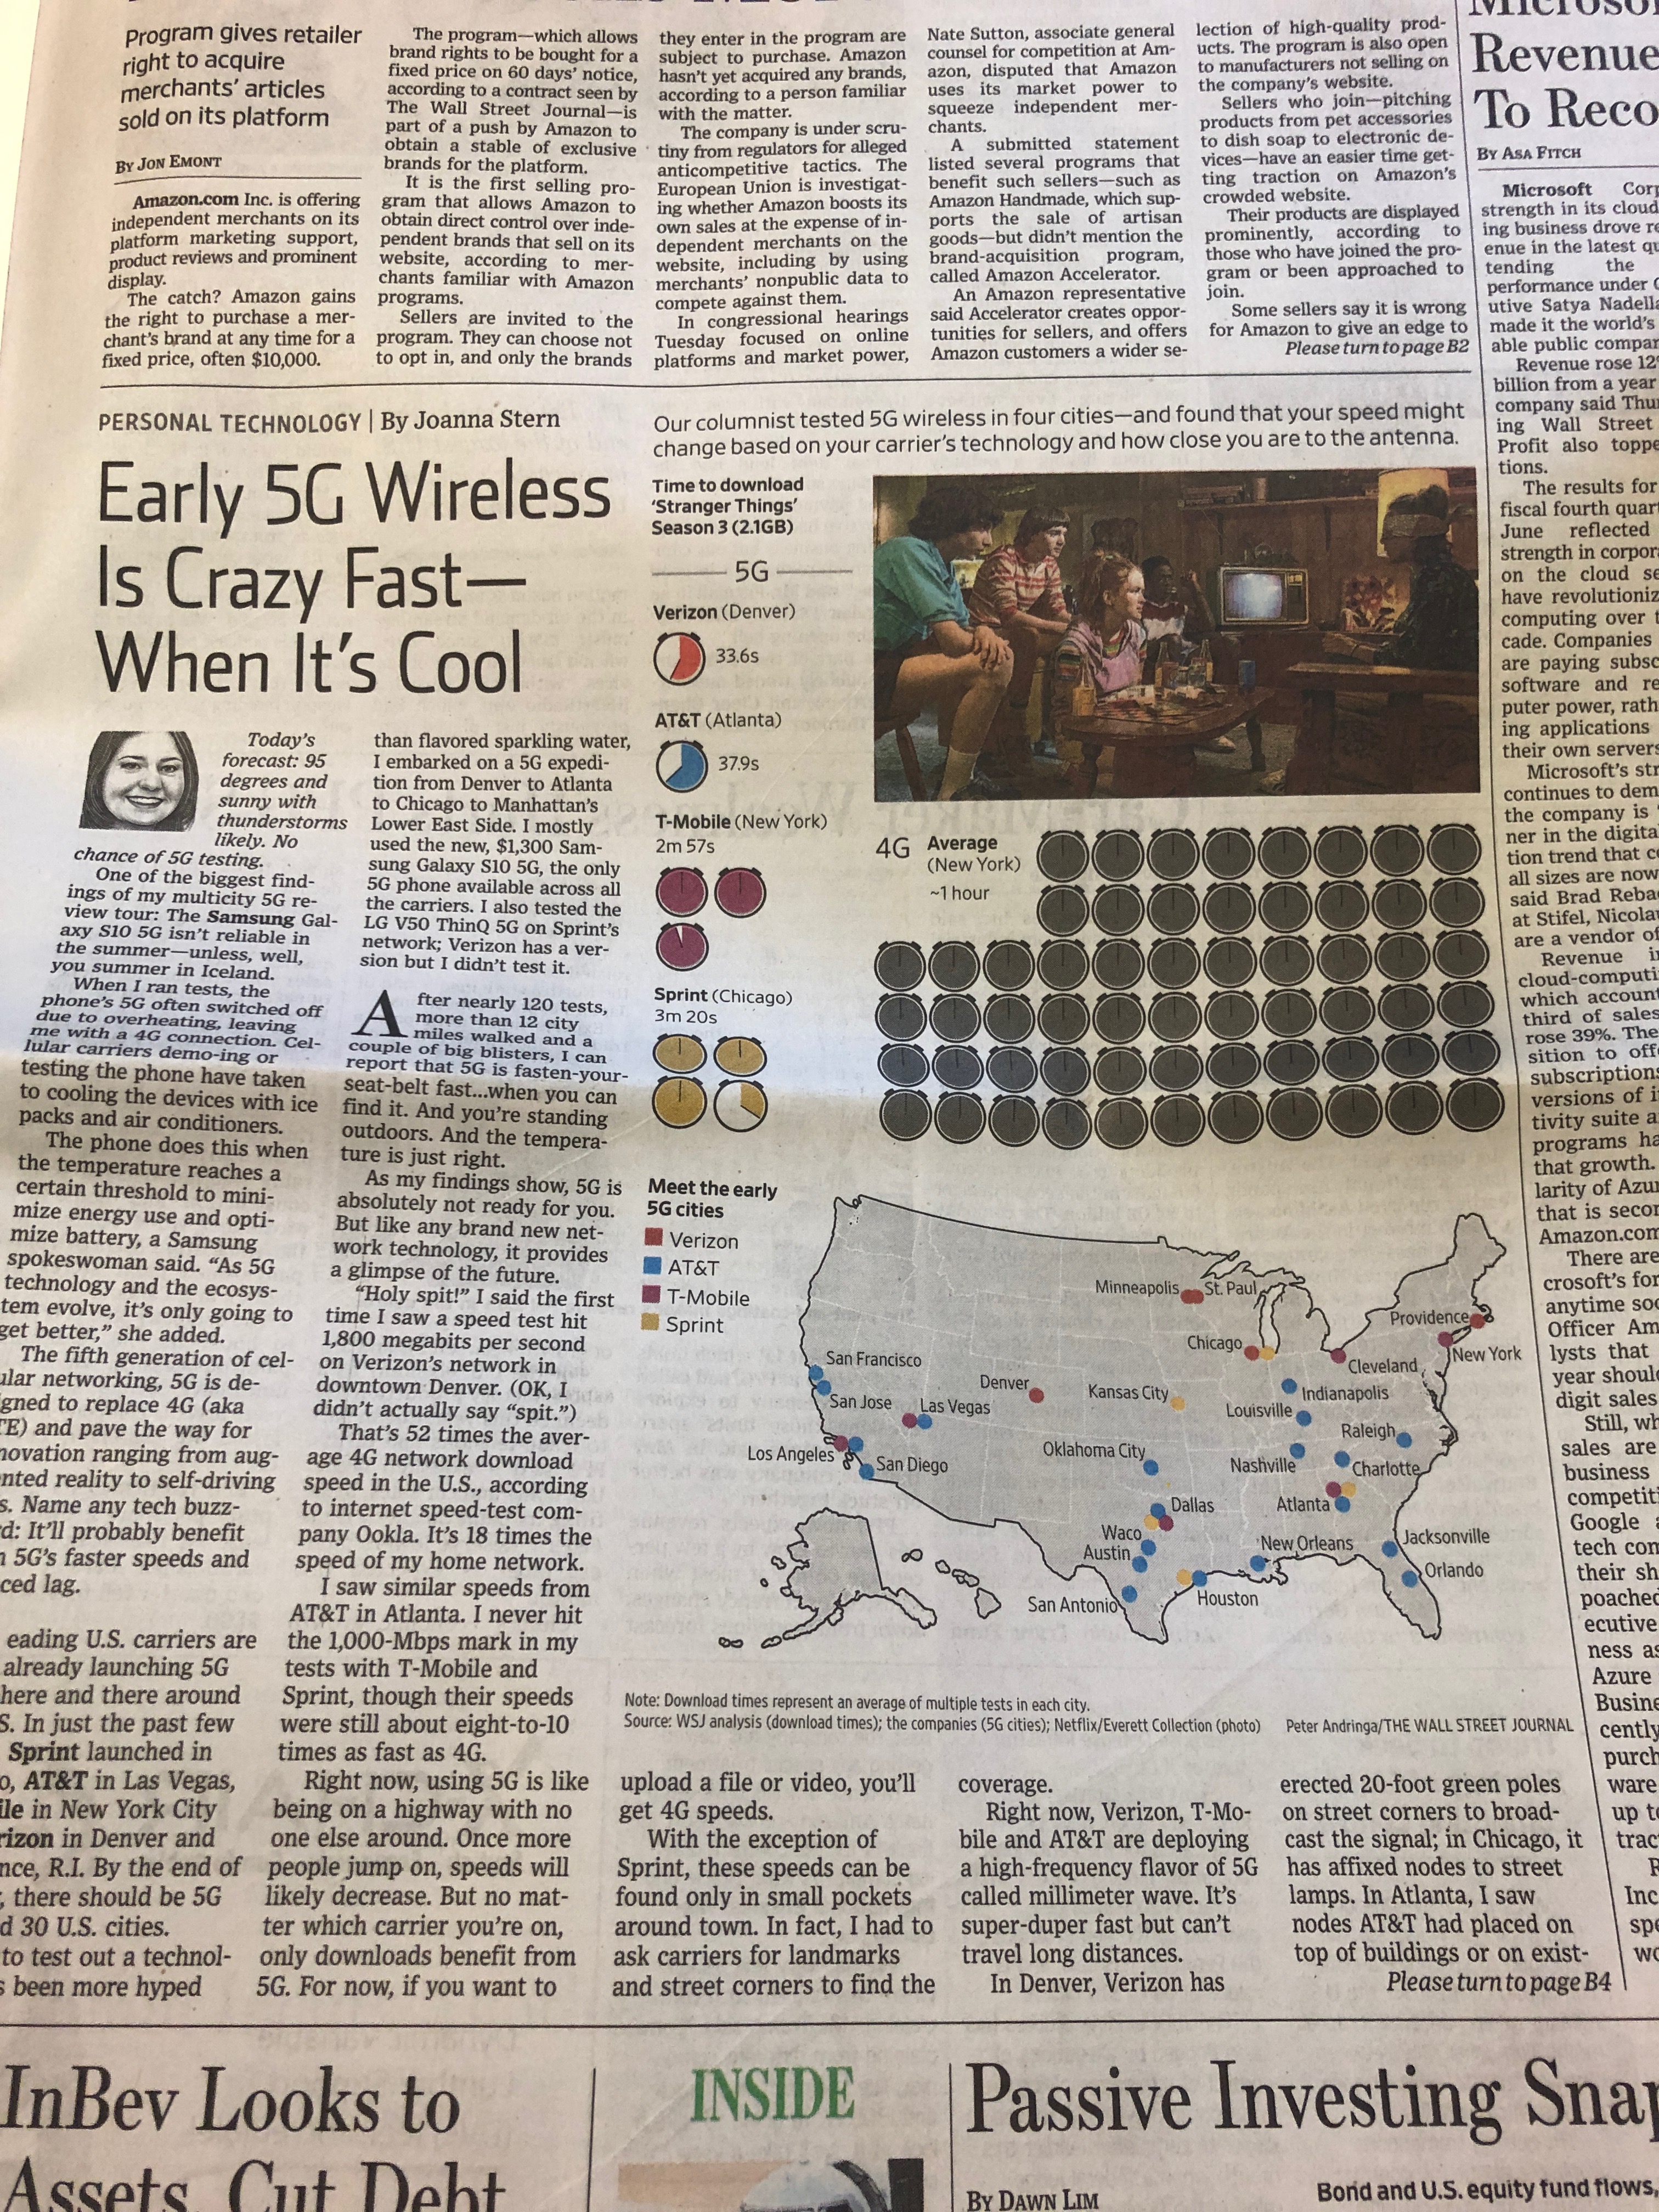
I worked with Joanna Stern, the Journal's personal tech columnist, to do a test of 5G networks in four cities across the country. I helped analyze her data, produced online graphics and explainers to accompany the column, and designed a print centerpiece for the cover of the Business & Finance section.
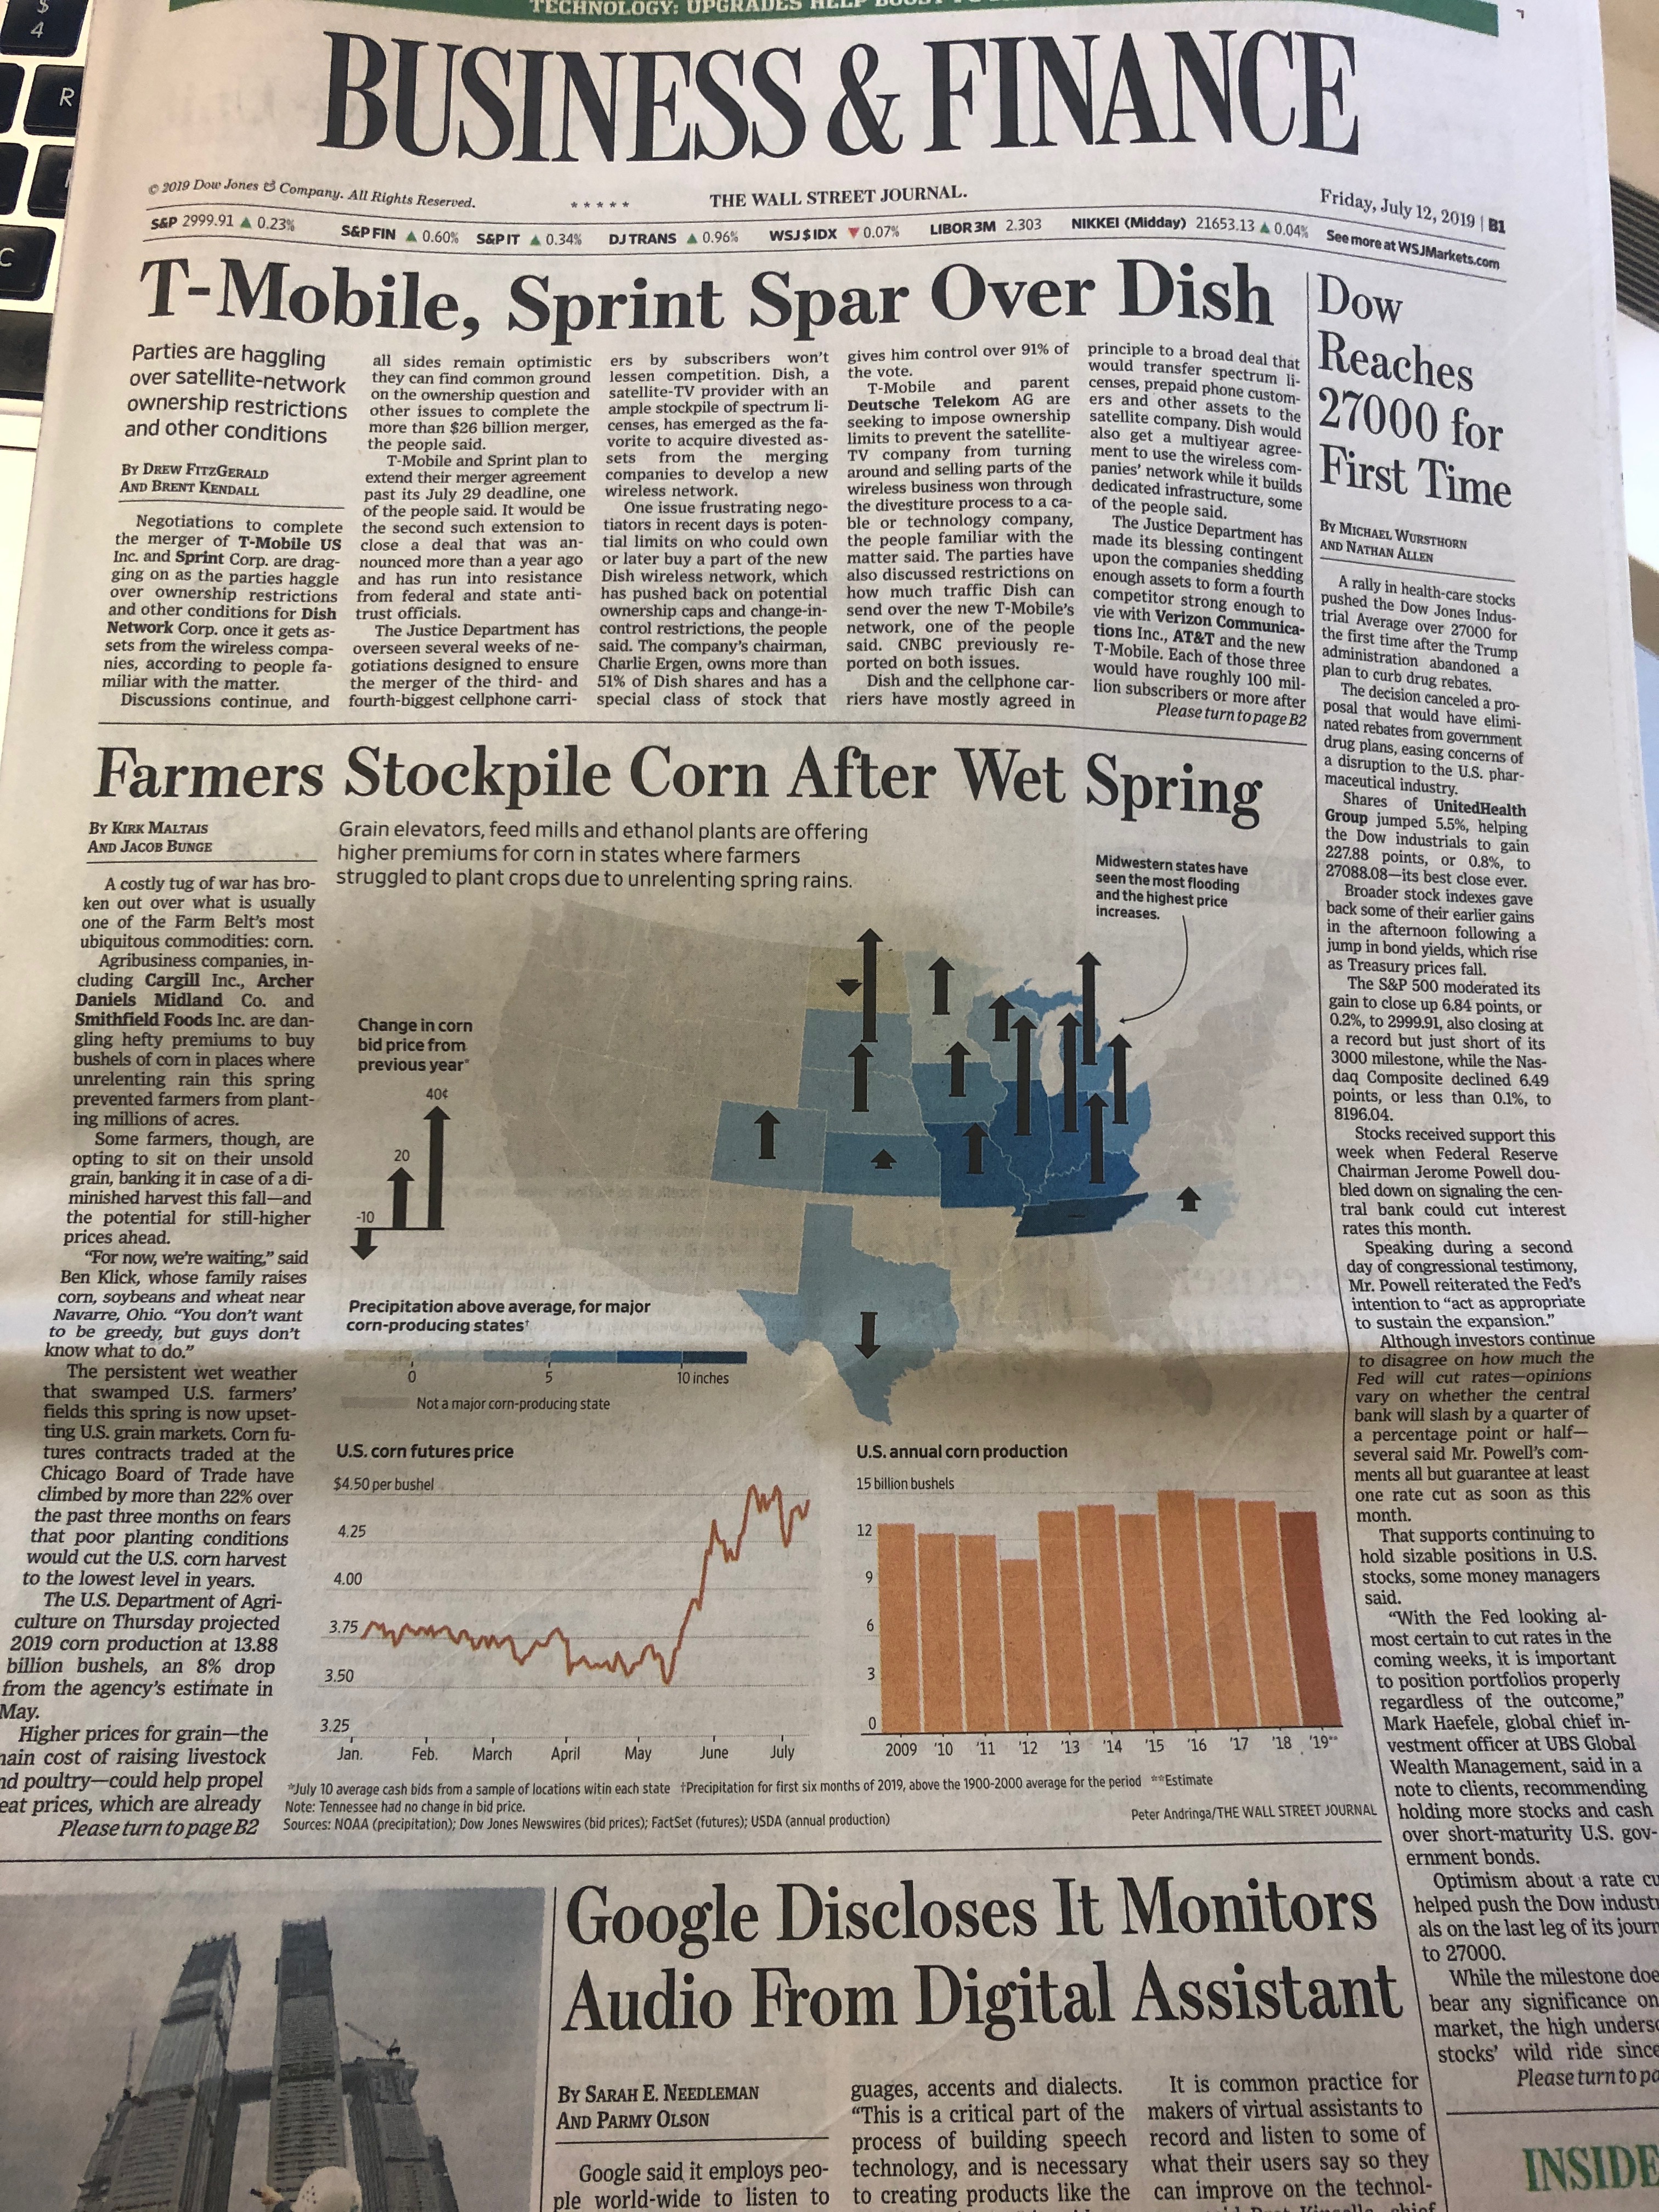
For this quick-turnaround graphic, I worked with The Journal's agriculture reporters to understand how farmers were responding to poor growing conditions. I collected data from NOAA and the USDA, processed it, and designed the web graphics and a B1 cover for the story.
To launch The Guardian's new series, "Guns and lies in America," I created an immersive, data-driven story looking at the decline in gun violence in the San Francisco Bay Area. I worked with The Guardian's reporters for the series to find and analyze data, design the visual identity, and build the data visualizations and custom article layout.
Towards the end of 2018, there was a general sentiment that the year was a particularly bad one for natural disasters. I conceptualized, designed, and built this data visualization to examine the real human cost of those events, and offer a deeper look at how climate change might be affecting the scale of weather-related disasters.
During one particularly busy day after British Prime Minister Theresa May announced her proposed Brexit deal, I worked with political writers and analysts, at the Guardian to illustrate the challenge she will face with an interactive game. The piece gained significant traction on social media, and remained on the homepage for two days.
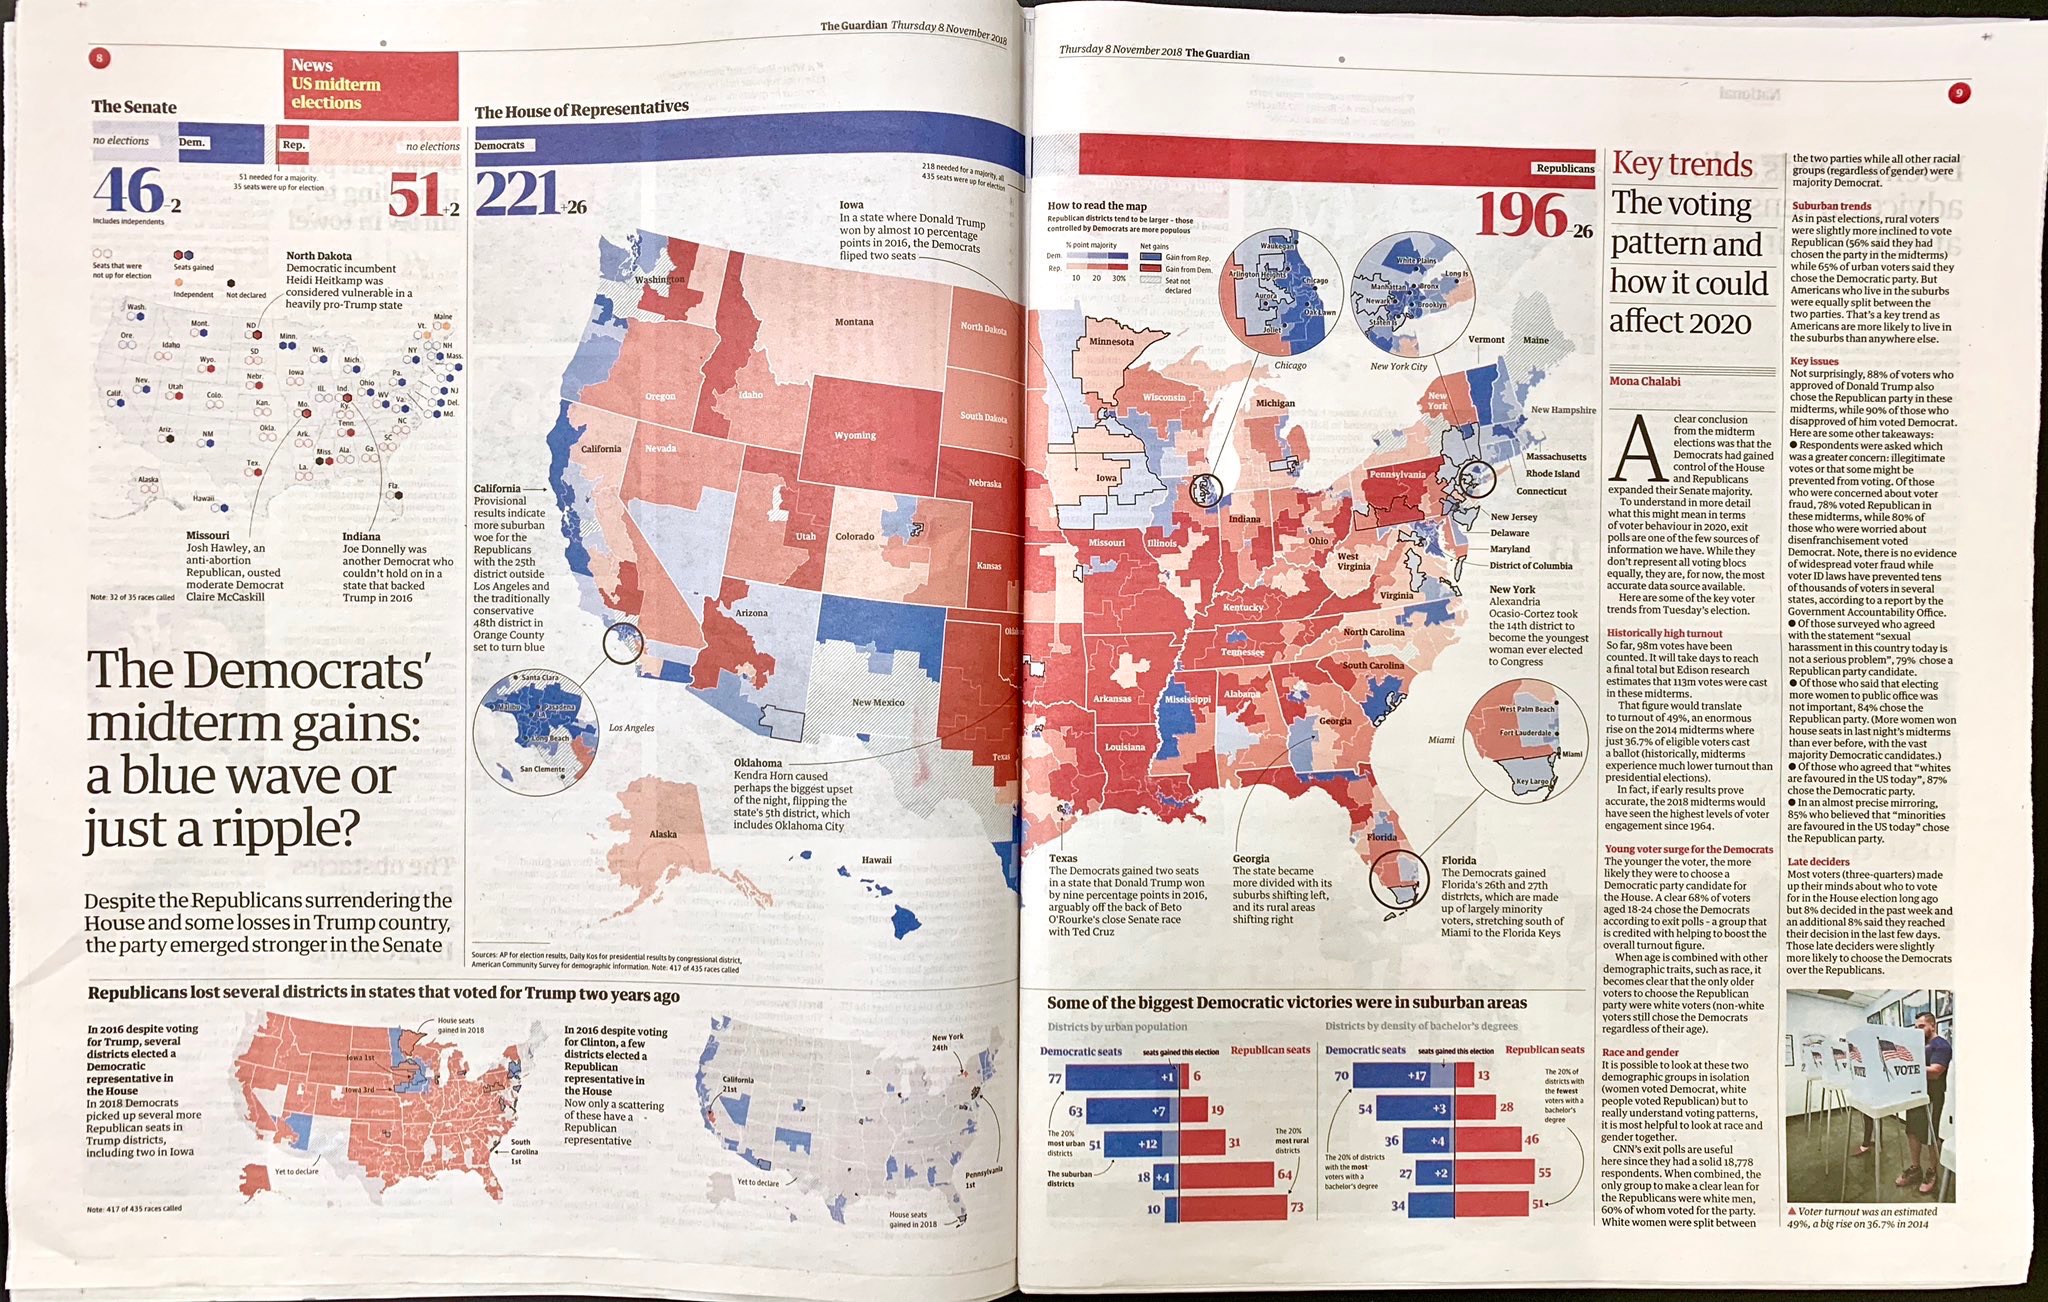
In the fall of 2018, The Guardian's UK-based Visuals team hired me to improve their midterm elections coverage. I built much of our back-end parsing of election data from AP, built a replayable staging environment, invented the live ticker of results, and designed and developed other React front-end components.
As the 2018 midterm election results were trickling in, I was busy preparing The Guardian's post-election visual analysis; helping build a swing map and comparing the night's results to US Census Bureau demographic information about the districts. Those quick-turn graphics ended up in this online story, as well as The Guardian's UK print edition.
This investigative story, based on an NYU dataset and Facebook’s new Ad Archive, explored the ways political groups use Facebook to target advertising, sometimes deceptively. After pitching the story, I conducted the data analysis, did original reporting and built an interactive that allowed readers to see what political ads were most often targeted at them.
I built this interactive news app that allowed viewers of NBC’s NECN station to track which potential presidential hopefuls were visiting New Hampshire, even two years out from the next presidential election. In the process, I also developed a new Python build tool that allows the team to more effectively deploy interactives that use Google spreadsheets.
This is one of a number of quick-turnaround projects I worked on for NBC, building a breaking-news interactive in just a few hours. This map scrapes wildfire data from the US Geological Service and plots it on OpenStreetMap, allowing readers to compare the size of California’s biggest-ever wildfire to their own city.
This is another quick-turnaround interactive I developed for NBC, based on one of my colleagues’ reporting about the thousands of migrant children being held in ICE detainment centers.
Using Facebook’s public page content API, I collected a dataset to track how Facebook users respond to the Facebook posts of many large news outlets. This story explores some of that data, using interactives and data visualizations to help illustrate some trends in how Facebook affects the news people consume. The data is also part of an upcoming research paper I co-authored with Phil Napoli, a professor at Duke, for the Association of Internet Researchers.
This news app, created in December 2017 for a class assignment, allows viewers to explore races in the upcoming midterm elections through campaign spending, news coverage, and race ratings. The Node.js backend integrates data from multiple APIs and web scrapers, to help readers notice where they should be paying attention on November 6.
An interactive I created for a class assignment that uses a WTO dataset to illustrate patterns and changes in world trade over the last 50 years.
While much of my work is in interactives and data visualization, I also enjoy longer-form narrative stories. In May 2018, I wrote this profile of a local housing activist for IndyWeek, an alt-weekly in North Carolina.